Skip to Content

Dashboards & data visualization

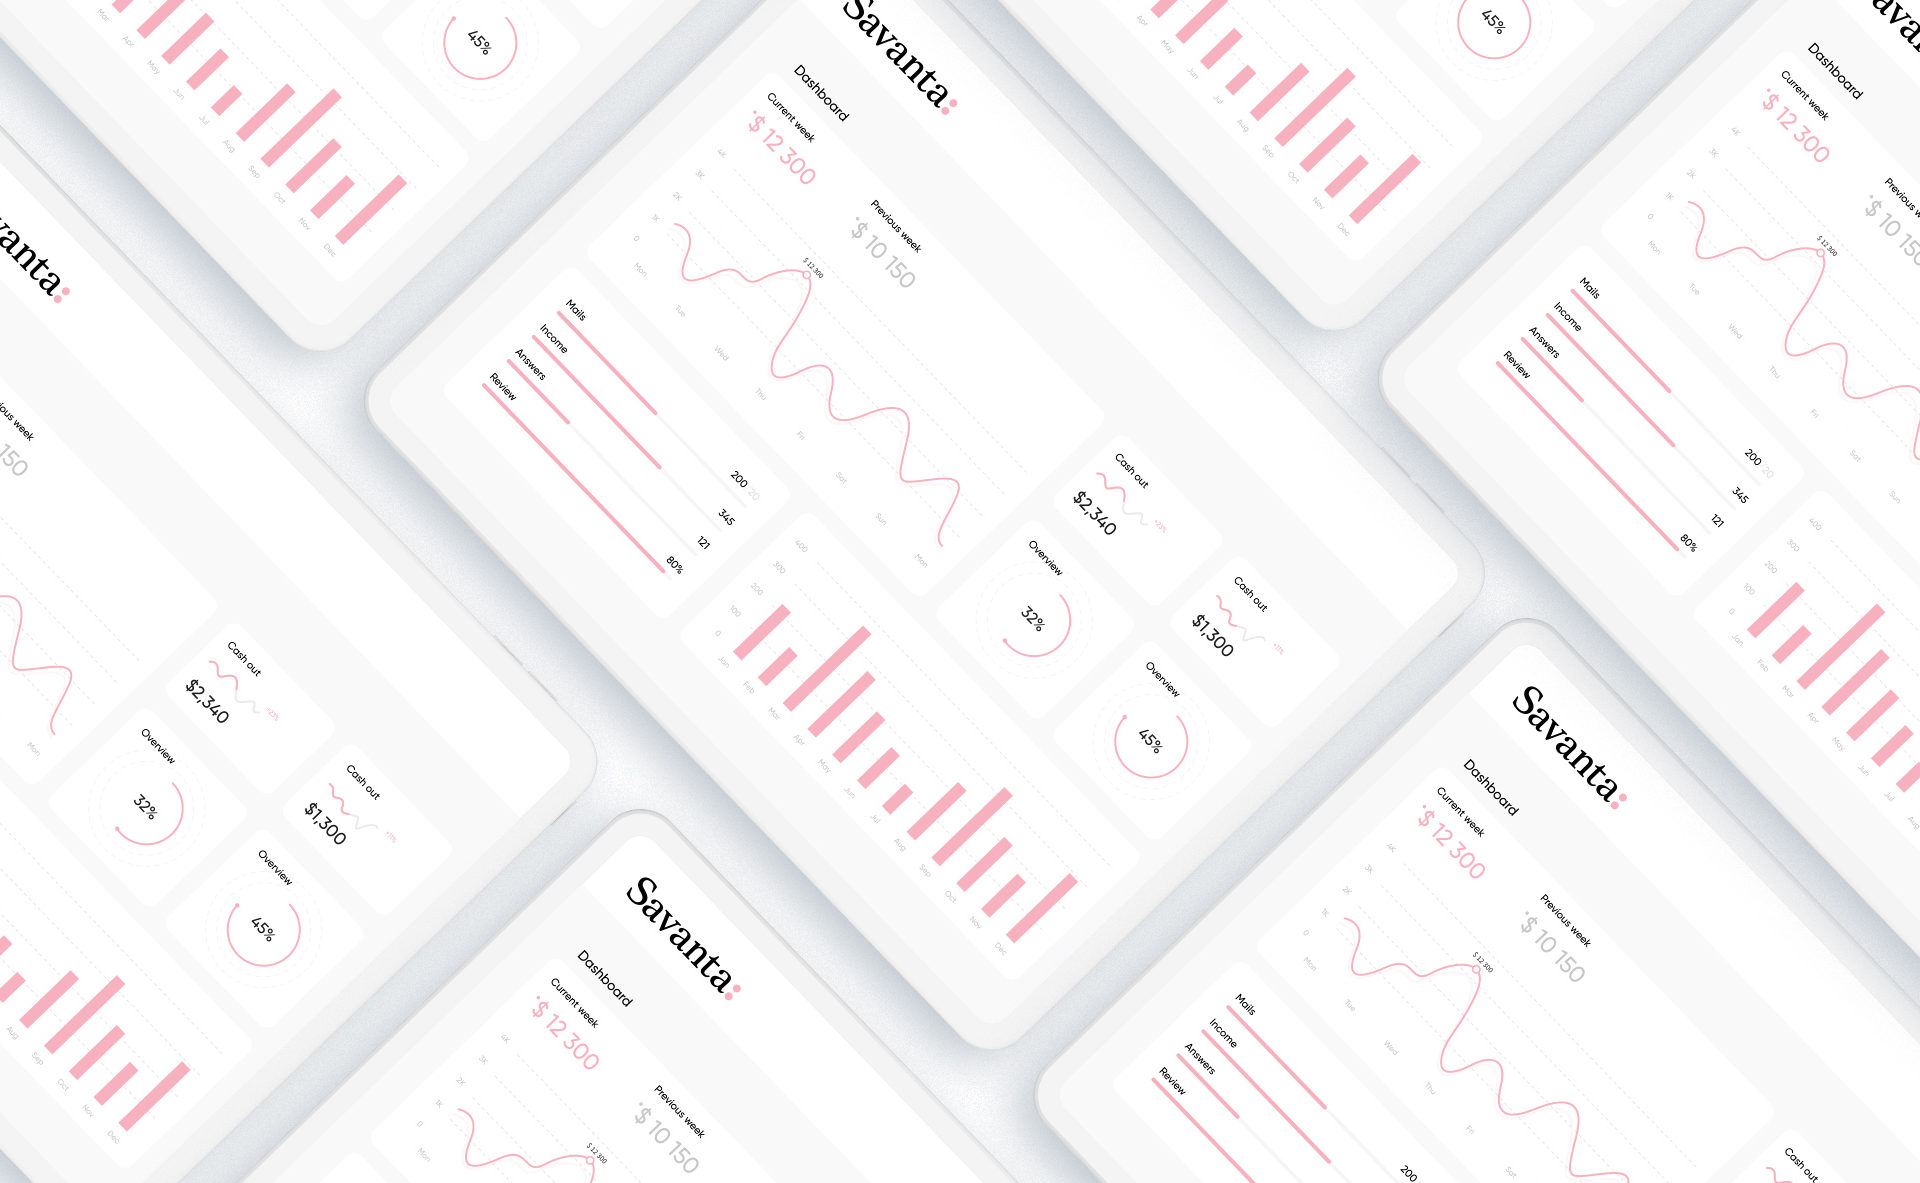
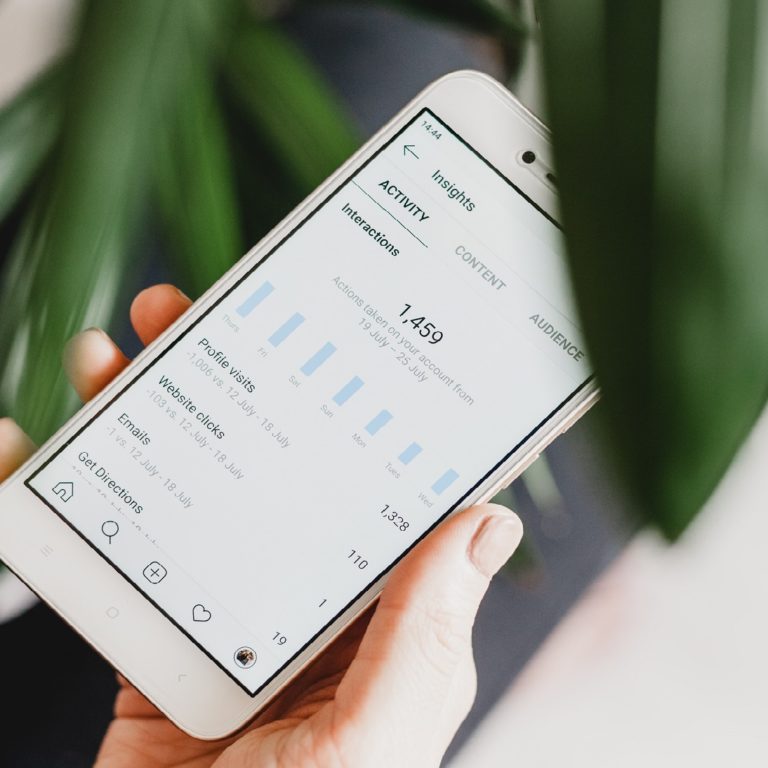
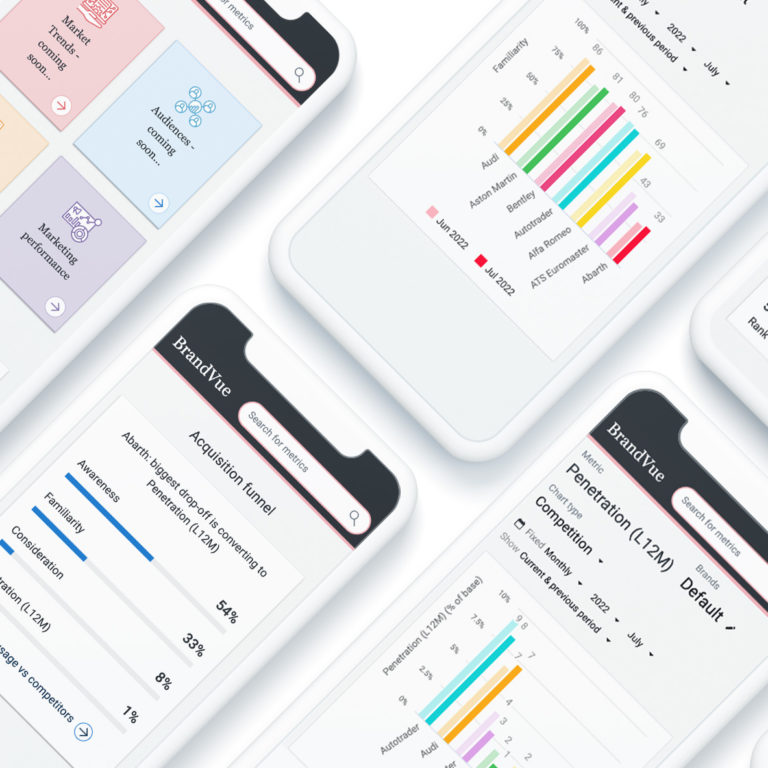
Bring your data collection to life through stunning visualizations that make sense of complex stats, patterns and trends. Evolve and set new priorities using our dashboards, and access data whenever you want, however you want, through our bespoke online portal.

Our approach

Research has no value until it’s used. This sits at the core of our thinking when producing research deliverables from data collection and analysis. That’s why our experts are driven to embed your insights into strategic action.

Highly skilled at visualizing research findings in line with project objectives, you’ll be empowered, with a clear line of sight to make informed business decisions.

Our portals are a fully white-labeled solution, capable of visualizing client data in real-time. Each build is completely customized to provide a variety of detailed and top line views, while fully accommodating historic and client database data

Research benefits

A home for insights

Our dashboards allow you to house all live and completed projects. Making it easy to collate, filter, search and act!

Manage quotas

Show quota breakdowns within a project, total target samples, completes remaining and how quotas are populating.

Locate documents

Upload and download documents securely using our FTP site; especially useful for client list projects.

Access real-time results

Provide a breakdown of individual questions shown in real-time, enabling you to click on tiles and create fancy charts.

Analyze data

Create your own cross-breaks in the data by question, giving you the ability to interlock the breaks and export into Excel.

Research methods

API development

Advanced analytics & data science

Technology

Our platforms

Knowledge center

View all
Explore

Get in touch

If you’d like to speak with one of our market research experts right now, please call: +1 (917) 768-2710